
Maths – Thursday 28th January
Our lesson today is all about reading and interpreting line graphs.
Watch the video which will take you through the steps needed to develop this skill.
Don’t forget:
- Watch and listen to the video carefully.
- Pause it when asked or whenever you need to check your understanding.
- Rewind it back whenever you need to see or listen to something again.
Here is the worksheet.
Don’t forget to do the questions when prompted by the video. The video is designed to help you with the questions so make sure you have watched it first.
Have a go at as many questions as possible.
For those of you struggling to see questions 3 and 4, here they are!
Challenge
Only attempt this AFTER you have done the worksheet.
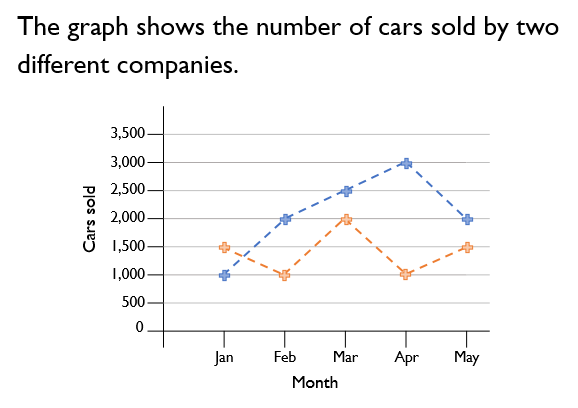
How many things can you interpret from this graph?
For example:
In January, the red company sold 500 more cars that the blue company.
The company that sold the most cars overall was the ????? one.
The ????? company sold ????? cars all together.
In ????? months out of 5, the ????? company sold more cars.
Maths:
1. a. 60cm b. 35cm c. its 80cm d. 20cm
2. the other questions are to small for me to see so i can’t do them sorry
Hello Kiran
Check 1c.
What kind of device are you on? Does the sheet look different to normal?
Mr Bushell
1) a) 60 cm b) 35 cm c) She is wrong because the mark is not on the line imbetween 70 cm and 80 cm d) 20 cm
2) a) 7000 b) 8500 c) No because it isn’t labeled and there is no point there d) 1970-80 1980-90 e) With the same increase as 2000-10 it would reach 12000
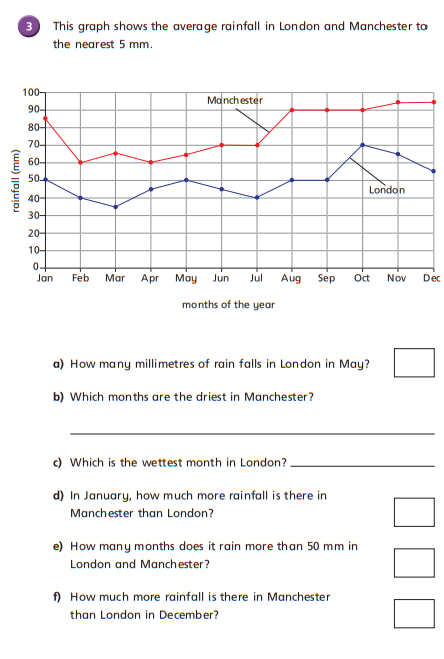
3) a) 50 mm b) February and April c) October d) 35 mm e) London=3 Manchester=12 f) 40 mm
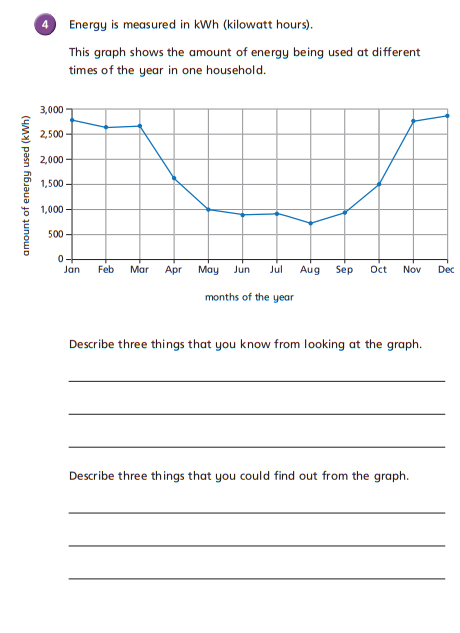
4) a) In the Summer months they use less energy. In Winter they use the most. In Spring it falls and in Autumn it rises b) In the Summer months they use less energy. In Winter they use the most. In Spring it falls and in Autumn it rises (I know that that is the same).
Well done Franek. We will review this in tomorrow’s Zoom session but it looks good overall.
Try the challenge.
Mr Bushell
1. A. 60cm
B. 35cm
C. She thought of that the difference in the box but it was two boxes.
D. 20cm
2. A. 7000
B. 8500
C. 7500 because the number in 1990 is close to the next line to 7500.
D. 1970-1980
E. At least 11’000 because every decade it has 500 new people.
3. A.50mm
B. April and February
C. October
D. 35ml
E. 19 months
F. 40ml
4. That they are more interested in outside as it is Summer and it is hot and probably not needed for electricity.
That in the cold season they use more electricity, they use less as they maybe go outside and use a lot of energy.
Challenge:
That the blue one sold more in total.
We will review this tomorrow Hargun.
For 1c, it is to do with the intervals on the left side of the graph.
For 2c, was it 1990 that you needed to find?
Check 3e – think about where London and Manchester both go above 50mm.
For the challenge, how many more did the blue one sell?
Mr Bushell
Half of 9000 is 4500
Oscar has 550 more
2936 – 1935=1001
8 14 20 32
1500 more cars
0. 1. 2. 3. 4. 5. 6. 7. 8. 9. 10
62. 70. 77. 82. 100. 110. 110. 110. 102. 98. 96
1500 cars were sold in June
1000 cars are sold
September
February and march
3 months
17 mm
No
50 mm
February and April
October
20 more rainfall
Manchester wet months are all above 50 mm
London October November December are above 50 mm
40 mm
We will review this tomorrow Jayden. Well done.
Maths
1.
A) 60 cm
B) about 35 cm
C) As it’s not exactly halfway in between 70 and 80.
d) 20 cm
2.
A) 7,000
B) 8,500
C) No as the graph is slightly not accurate.
D) 1980 to 1990
E) 12,000
3.
A) 50 mm
B) February and may
C) October
D) A 35 mm difference
E) 15 months with more than 50mm.
F) A 40mm difference.
4.
A) 1. that they use a lot of kWh
2. during summer they use a low amount of kWh
3. during winter they use a lot of kWh
B) 1. During the colder months thay use heating so that could be why they use a lot of kWh.
2. During the warmer months they don,t use heating so there isn’t as much kWh being used.
3. during spring they use an ok amount of kWh to keep the house warm.
Challenge
In January, the red company sold 500 more cars that the blue company.
The company that sold the most cars overall was the blue one.
The red company sold 7,000 cars all together.
In 4 months out of 5, the blue company sold more cars
Great effort Owen!
Question 1 is spot on. For question 2, check c. The graph is accurate! Look at the years carefully and think about why 1991 is more difficult to work out.
Check 3b and e.
Great effort with question 4.
You have shown a good understanding.
Mr Bushell